Observability is a critical aspect of modern software development, providing teams with the ability to monitor and understand the performance of their applications and infrastructure.
Recently, several companies have emerged as leaders in the observability space, offering comprehensive solutions for monitoring and analytics. In this post, we’ll take a detailed look at five leading observability companies – Appdynamics, Datadog, Dynatrace, ManageEngine, and New Relic – comparing their features, advantages, and potential drawbacks.
Table of Contents
Choosing the Right Observability Platform
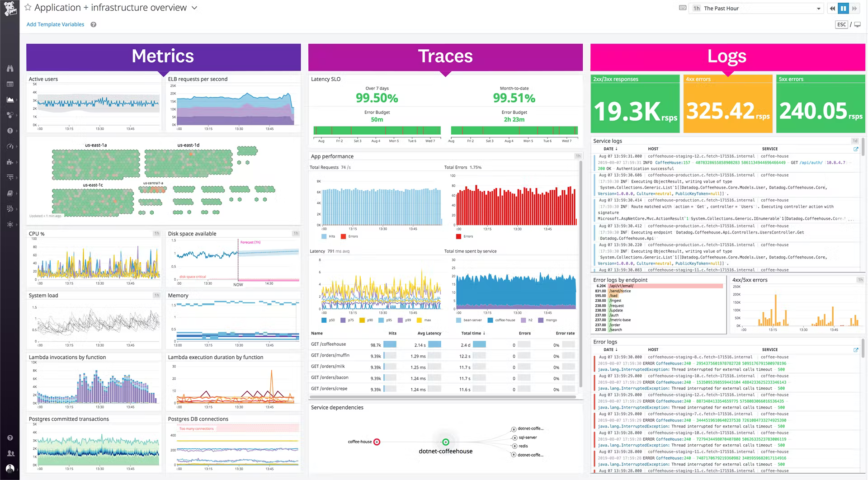
Observability platforms have become essential for ensuring the performance, reliability, and availability of modern applications. With so many options available, choosing the right observability platform for your business can be a daunting task. Let’s discuss what you should look for when selecting an observability platform, including key features, pricing, scalability, and ease of use.
Capabilities
One of the primary benefits of an observability platform is its ability to provide comprehensive monitoring capabilities for your entire technology stack. Customers should look for a platform that offers real-time monitoring of key metrics, logs, and traces, as well as the ability to quickly identify and diagnose issues when they arise. The platform should also provide easy-to-understand dashboards and visualizations, which can help teams quickly identify areas that require attention.
Scalability
As your organization grows and your technology environment becomes more complex, the observability platform you choose should be able to scale to meet your needs. It’s important to look for a platform that can handle high data volumes, supports multiple integrations, and provide flexible deployment options to ensure that it can keep up with your organization’s growth.
Ease of Use
While powerful observability capabilities are essential, it’s equally important to choose a platform that is easy to use and understand. A platform with an intuitive user interface, easy-to-understand dashboards, and clear reporting can help teams quickly identify and respond to issues. Additionally, choosing a platform that provides customizable alerts and notifications can help teams proactively address issues before they become larger problems.
Integration
Each organization’s technology environment is unique, so the observability platform you choose should be able to integrate with the tools and technologies you’re already using. Additionally, a platform that offers customizable dashboards and reporting can help teams get a more tailored view of their technology stack and identify areas that require attention more quickly.
Support
Finally, the platform should offer extensive support, including easy-to-access documentation, responsive customer support, and a community of users who can help answer questions and provide support.
Pricing
Pricing is another important factor to consider when selecting an observability platform. Most platforms offer a range of pricing tiers with different levels of functionality and support. You should carefully evaluate your needs and budget to determine which pricing tier is right for you. Remember that some platforms can be relatively expensive, particularly for larger organizations or those with many application components.
Putting it all together
By taking the above-mentioned factors into consideration, customers can make an informed decision to select the appropriate observability platform, enabling teams to swiftly identify and address issues, proactively tackle potential problems, and ensure the continued success of their technology environment.
With this in mind, let’s look at just five of the top observability platforms in this space:
Appdynamics
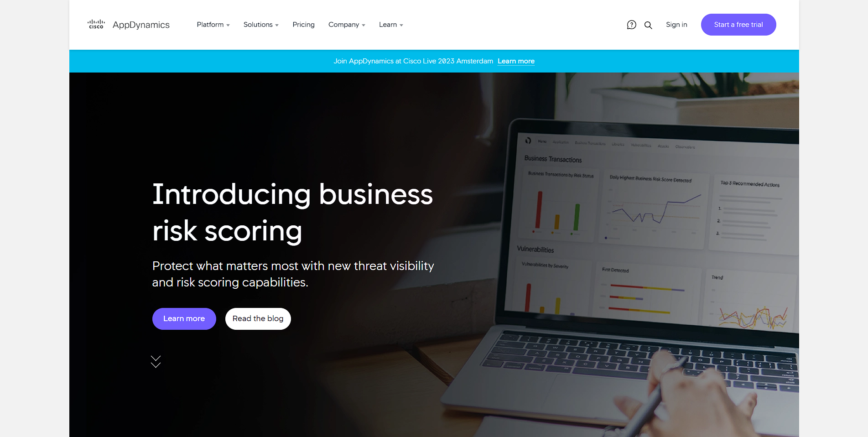
Appdynamics is a comprehensive observability platform that provides real-time insights into application performance, user experience, and business impact. It offers end-to-end visibility across distributed architectures, including microservices, cloud-native, and hybrid environments. Appdynamics provides many features for troubleshooting and root cause analysis, such as code-level diagnostics and distributed tracing.
- Appdynamics provides end-to-end visibility across distributed architectures.
- One potential drawback of Appdynamics is its cost, which may be a barrier for small to mid-sized organizations.
Datadog
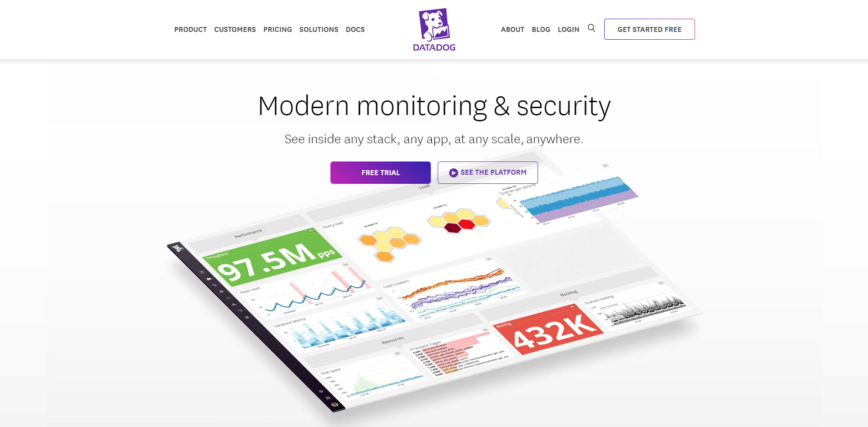
Datadog is a cloud-based observability platform that provides comprehensive monitoring and analytics for applications, infrastructure, and logs. It offers a wide range of integrations, making it a versatile option for DevOps teams. Datadog’s APM features provide detailed insights into application performance, while its infrastructure monitoring capabilities offer visibility into servers, databases, and network devices.
- Datadog offers comprehensive monitoring and analytics for applications, infrastructure, and logs.
- It may require additional configuration and setup to access some of the many integrations and customizable features.
Dynatrace
Dynatrace is an AI-powered observability platform that provides automated, continuous monitoring for cloud-native and hybrid environments. It offers real-time analytics, full-stack visibility, and automated root cause analysis. Dynatrace uses machine learning algorithms to provide actionable insights and alerts, making it an attractive option for DevOps teams.
- Dynatrace features AI-powered analytics and alerts for automated root cause analysis.
- Some users may find that Dynatrace includes more functionality than they actually need, which can lead to unnecessary complexity and cost.
ManageEngine
ManageEngine is an IT operations management platform that offers a range of solutions for monitoring applications, networks, servers, and databases. It provides a comprehensive set of features for root cause analysis, troubleshooting, and incident management. ManageEngine’s observability solution offers real-time insights into application performance, end-user experience, and infrastructure health.
- ManageEngine provides a comprehensive set of features for root cause analysis, troubleshooting, and incident management.
- One potential limitation of ManageEngine is its focus on traditional IT operations, which may not be well-suited for cloud-native or hybrid environments.
New Relic
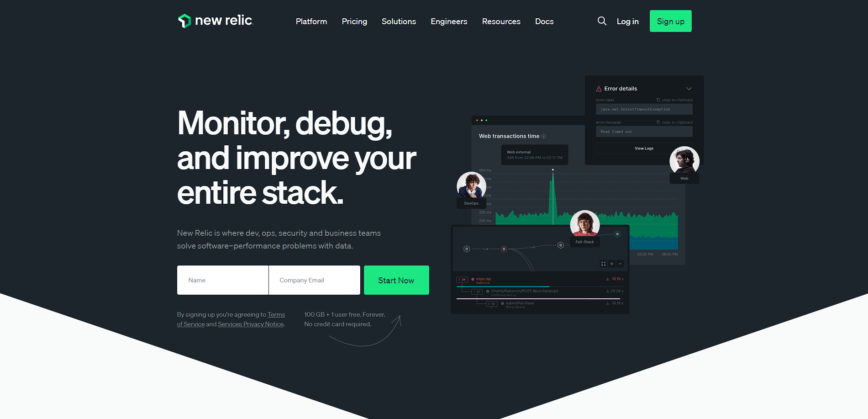
New Relic is a cloud-based observability platform that provides a comprehensive solution for monitoring applications, infrastructure, and user experience. It supports various programming languages and platforms, including cloud-native, hybrid, and on-premises environments. New Relic’s AIOps capabilities use machine learning algorithms to detect and resolve issues automatically, making it an attractive option for DevOps teams.
- New Relic is a leader in their AIOps capabilities for automated issue detection and resolution.
- One of the challenges of New Relic is its complex user interface, which can be overwhelming for new users.
The Platforms vs. Observability’s Key Factors
These platforms are popular observability solutions that offer comprehensive monitoring capabilities for applications, infrastructure, and business metrics. They all provide real-time insights into the performance of an organization’s technology stack, enabling teams to quickly identify and respond to issues when they arise.
Pricing for these leading platforms can be a bit on the higher side, especially for larger organizations. However, they offer transparent pricing with no hidden costs or surprises, and customers can choose from a range of pricing plans based on their specific needs.
Regarding scalability, these platforms are designed to handle high volumes of data and support a wide range of integrations with third-party tools and technologies. They also provide flexible deployment options, allowing customers to customize their setup based on their specific needs.
With the exception of New Relic’s “new” UI – subject to opinion – the above platforms excel in ease of use. The interfaces are intuitive and easy to navigate, with customizable dashboards and reports that enable teams to get a more tailored view of their technology environment. Additionally, they all feature customizable alerts and notifications, helping teams proactively address issues before they become larger problems.
All aforementioned platforms support many integrations, including popular tools such as AWS, Azure, Kubernetes, and other tools and technologies they’re already using.
Lastly, they provide extensive documentation, responsive customer support, and a community of users who can offer support and guidance.
In Conclusion
Overall, the above platforms meet all key factors customers should consider when selecting an observability platform. Comprehensive capabilities, scalability, ease of use, integration, and support. However, it’s always essential to evaluate multiple options and compare them to determine which platform best meets your organization’s needs.
For a larger list of platforms and other observability and monitoring solutions, read my list of 100 Top Observability Tools (+ Server Monitoring and APM solutions). Also, read my article: Observability: 15 Industry-Leading Companies Discuss its Evolution.
Selecting the right observability platform can make all the difference in application performance and reliability. New Relic, Appdynamics, Dynatrace, Datadog, and ManageEngine are among the leading companies in the observability space, each offering unique features and benefits. By comparing and understanding the advantages and potential drawbacks of each platform, you can make an informed decision that meets the needs of your organization.

