Database monitoring is indispensable for maintaining the health, performance, and reliability of your database system. It provides administrators and IT teams with real-time insights into the system’s operations, enabling them to proactively identify and address potential issues before they need to be escalated.
You can confirm your database operates efficiently and delivers optimal performance by monitoring key metrics like query performance, transaction rates, and connection usage. This also safeguards the integrity of your data, helps prevent costly downtime, and provides a smooth user experience for applications that rely on the database.
Table of Contents
How to monitor key database performance monitoring metrics
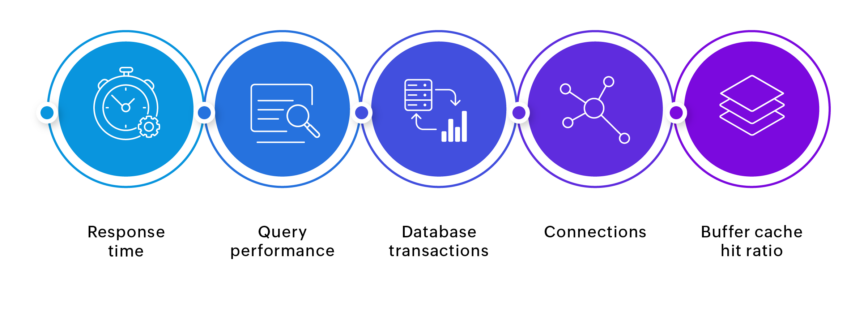
To ensure your database operates efficiently, you should monitor several key metrics, some of which are specifically tied to the requirements of your applications and database configurations. Here are five key metrics to monitor to ensure optimal database performance:

Response time

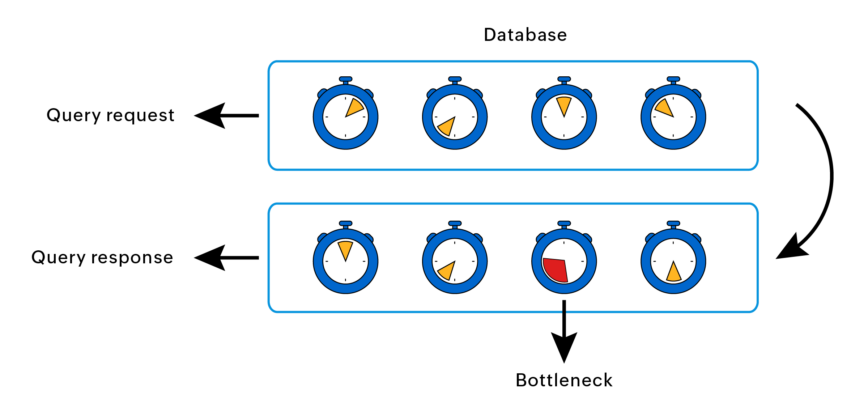
Database administrators frequently wonder “Why is my database performance so sluggish?” This often stems from issues like slow query processing and prolonged wait times, which directly impact response time. When your database shows a significantly higher average response time, it’s a cause for concern but not panic. Here’s what you can do:
Step 1: Investigate the scope
Global or specific: Does the slowness affect all queries or just specific ones? After narrowing the search area, isolate database inefficiencies and performance bottlenecks. Analyze query execution plans, indexing strategies, and resource utilization to identify the root cause of the slowness.
Peak or sustained: Is it a temporary spike during peak hours or a constant issue? Understanding the pattern helps diagnose the root cause.
Step 2: Analyze response time components
Identify the slowest running queries using performance dashboards and focus on these for optimization. Additionally, check for error messages or warnings related to slow queries.
Step 3: Check system-level metrics
Keep an eye on resource utilization parameters like CPU, memory, and disk I/O usage as high utilization in any area can cause performance bottlenecks. Additionally, it’s imperative to track concurrent connections and database locks as they can indicate resource contention.
Step 4: Implement optimization techniques
Create appropriate indexes on frequently used columns to speed up data retrieval. Regularly update your baseline response time and monitor trends to identify slowdowns early.
Query performance
Subpar database performance often stems from inefficient queries. These slow queries take an unnecessarily long time to retrieve data, impacting overall application responsiveness and user experience. Let’s say a healthcare application that helps users schedule appointments with doctors is running on SQL Server. Each appointment request initiates queries to check doctor availability, update patient records, and allocate resources. If these queries experience delays, it can cause frustration among patients and staff. More often than not, even with ample server resources, inefficient queries, suboptimal database design, or outdated statistics can cause bottlenecks.
An example of an inefficient query pattern is the N+1 query problem. This occurs when, instead of fetching everything in a single optimized query, the system executes a separate query (N additional queries) to grab related data for each result returned by the initial query. Imagine retrieving a list of patients—an N+1 anti-pattern would involve a separate query to fetch each patient’s medical history instead of combining both sets of information into a single efficient query.
Identifying this problem involves monitoring the number of database calls generated by specific operations. A significantly higher-than-expected number of calls from a single user action could indicate an N+1 issue.
To address these challenges, begin by pinpointing queries that exhibit prolonged execution times. A good approach is to track the top ten most frequent queries received by the database server, along with their average latency. By optimizing these frequently used queries, significant performance improvements can be achieved, enhancing the overall efficiency of the database system.
Database transactions
Transactions are fundamental to maintaining data integrity and act as a logical unit that groups several key steps into a single operation. This ensures that either all the steps within the transaction succeed or none do, with both actions preventing inconsistencies in your data.
However, monitoring these transactions presents challenges. The sheer volume of data generated by high-throughput databases can make it difficult to identify anomalies within transaction logs. Additionally, sometimes the monitoring process itself can add overhead to the database, potentially impacting performance if it is not implemented efficiently.
Here are two ways you can effectively monitor your database transactions:
- Periodic performance optimization: Monitoring transactions allows you to identify issues like deadlocks and rollbacks that compromise data integrity. Additionally, by tracking transaction rates and durations, you can pinpoint bottlenecks within transactions or slow queries impacting their completion time.This targeted approach enables you to optimize areas that specifically hinder performance. For instance, monitoring might reveal a surge in transactions during peak hours (e.g., every weekday between noon and 1pm). By analyzing these transactions, you could identify and optimize a specific slow query that’s causing delays for users.
- Stress testing for proactive capacity planning: Monitoring real-time transaction rates and resource utilization provides valuable insights, but it doesn’t necessarily tell the whole story. A process like stress testing allows you to assess how your database performs under high load by simulating a high volume of transactions or user activity.This proactive approach helps you identify potential bottlenecks or resource constraints before they blow up. By performing stress tests at regular intervals and monitoring transaction behavior during the tests, you can proactively scale your database infrastructure or optimize transactions to handle peak loads effectively.
Connections

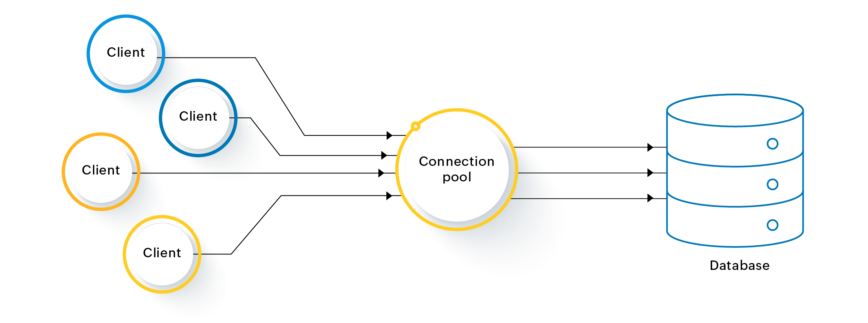
Each user or application that interacts with the database needs a connection to send queries and receive results. However, opening and maintaining a separate connection for every user can be resource-intensive, especially for dynamic web applications with multiple users.
Tracking metrics like active and idle connections, connection pool size, and connection wait time helps you by identifying and addressing potential performance issues. Furthermore, understanding your typical connection usage patterns helps you plan future growth and scale your database infrastructure or connection pool to handle increased traffic without performance degradation.
Here are some optimization strategies to enhance the efficiency of database connections:
- Reviewing code and prioritizing fixes: Focus on your application or website code. Identify sections where database connections are opened but not explicitly closed. This could be due to missing close () statements after database operations or improper exception handling that leaves connections open longer than necessary.
Connection pool tuning: Profile connection pool behavior is used to understand how connections are borrowed, reused, or returned to the pool, which provides insights into the efficiency and effectiveness of connection management. Configure and tune connection pool settings to match the requirements of your applications requirements. Adjust parameters such as maximum connections, idle timeout, and connection reuse.
- Periodic monitoring and alerting: Set up regular monitoring of connection metrics using database monitoring tools or custom scripts. Implement alerts for scenarios such as exceeding connection limits, long connection durations, or high connection pool utilization.
Buffer cache hit ratio
The buffer cache hit ratio is a critical metric in database monitoring because it directly impacts performance. To effectively monitor this metric, it’s important to track buffer cache hits and misses, peak usage periods, query patterns, etc. Usually, a high buffer cache hit ratio indicates that most data requests are satisfied from the cache, reducing the need for costly disk I/O operations. If it’s low, you can:
- Optimize queries and indexes: Review and optimize SQL queries to reduce the amount of data read from the disk. Use appropriate indexes to improve data retrieval efficiency.
- Increase cache size: If feasible, consider increasing the size of the buffer cache to accommodate more data in memory. However, this approach should be balanced with available system resources and memory requirements of other applications.
- Monitor and fine-tune: Continuously monitor the buffer cache hit ratio and related metrics to track improvements or changes. Set up alerts for low hit ratios, allowing for proactive investigation and remediation.
Take the guesswork out of database monitoring
Effectively monitoring your database for optimal performance, data integrity, and user experience is essential. However, managing these metrics individually can be cumbersome. That’s where ManageEngine Applications Manager comes in. This database monitoring solution provides a comprehensive view of your database health, identifies bottlenecks in advance, and proactively supports your applications and users.
Supporting a wide range of databases, from popular commercial vendors to open-source options like Oracle, Microsoft SQL, MySQL, MongoDB, Cassandra, memcached, and Redis, Applications Manager ensures seamless monitoring across your entire IT infrastructure. To learn more about how Applications Manager can benefit your organization, contact our solution experts for a walk-through or download a free 30-day trial today.


