Remote Dictionary Server (Redis) is an open-source NoSQL database that comprises of a fast, in-memory data structure to store data in key-value pairs. It serves as a fast and highly efficient data store that is utilized for its database, caching, message broker, real-time analytics, and data storage capabilities.
In this article, you will learn the significance of monitoring Redis databases and the crucial metrics that need to be monitored for the enhanced functioning of your day-to-day business operations.
Table of Contents
What is Redis monitoring?
Redis monitoring is the process of monitoring the health and performance of your Redis databases to guarantee high availability and accessibility to the data contained within them. It monitors essential Redis performance indicators and provides detailed information about resource usage and capacity planning for swift incident resolution during performance outages.
Why is Redis monitoring important?
Many companies prioritize adopting Redis into their business infrastructures due to its reputation as one of the fastest NoSQL databases that provides quick access to data storage. Its high efficiency, ease of use, and versatile data structure make it the most sought-after database for critical business operations, including gaming, messaging, financial services, and real-time data analytics, all of which require rapid access to data. Any disruption in Redis performance can have a significant impact on business operations, potentially leading to loss of revenue and tampered brand reputation.
Gaining thorough insight into the performance of your Redis databases is crucial to prevent any declines in performance and can save you a great deal of time during incident resolution. This entails continually monitoring your Redis metrics around the clock to guarantee high availability and outstanding business performance, making it essential to have a reliable Redis monitoring solution in place.
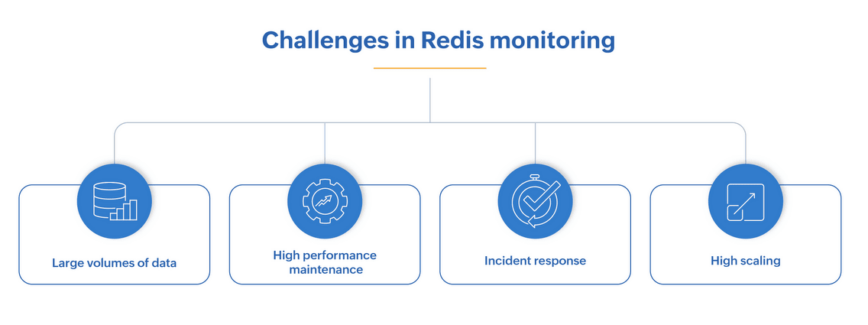
What are the challenges in Redis monitoring?

Although Redis is a rapidly growing NoSQL database incorporated among businesses, it has some time-bound management issues that, if not resolved promptly, can negatively affect business results. Below are some of the challenges in Redis monitoring:
- Large volumes of data: As Redis is primarily known for its ability to handle lightweight data efficiently, managing large amounts of data simultaneously can cause Redis to perform poorly, resulting in slower response times.
- High performance maintenance: Ensuring top, around-the-clock performance of your Redis servers becomes compulsory for rapid data storage access, especially when dealing with critical business operations.
- Incident response: Not addressing Redis performance problems promptly can have significant consequences on business operations, leading to additional work for database administrators to fix.
- High scaling: Scaling up your business operations can cause an increase in data and user handling, mandating you to scale up your Redis database to retain high performance.
What are the key Redis metrics to monitor?
Since Redis is renowned for its rapid and dependable data storage access, monitoring its performance becomes crucial. As Redis functions as a message broker, caching, and data storage solution for performing fast-paced business operations, the probability of encountering a server outage increases when dealing with numerous requests.
To guarantee optimal Redis database performance, it is important to monitor various key performance metrics for ensuring optimum business efficiency. The following are some of the key metrics to track in Redis monitoring:
CPU usage
CPU usage refers to the amount of CPU utilized by the processes of the Redis server. High values of CPU usage might indicate your Redis server is overworked and can affect overall performance if left unattended. Constant monitoring of CPU usage values and analyzing usage patterns can help you understand how your Redis server is functioning overall, enabling you to optimize performance and plan capacity accordingly.
Below are the list of CPU usage metrics to be monitored:
- System CPU Usage: This metric measures the amount of CPU that is used by operating system-initiated processes of the Redis server.
- User CPU Usage: This metric measures the amount of CPU that is utilized by user-initiated processes of the Redis server.
Memory usage statistics
Memory is an important component to be considered in Redis performance. Since Redis is an in-memory data store that’s mainly used for storage, it is vital to keep a close eye on the amount of memory consumed by your Redis servers. High memory usage can cause unwanted memory errors, stunted performance, and by extension, can even lead to server disruptions.
Below is the list of memory metrics you should monitor:
- Used Memory: This metric indicates the amount of memory allocated to Redis using the functionality for managing memory occupancy. Keeping track of this metric can help you prevent out-of-memory errors in your database.
- Used Memory RSS: This indicates the amount of memory that is allocated to Redis by the operating system.
- Peak Used Memory: This metric refers to the maximum amount of memory consumed by the Redis server. This will give you a clear idea of the peak memory that might be needed for your Redis server to function.
- Memory Fragmentation Ratio: This metric is the ratio of the used memory to that of the RSS memory of the Redis server. Monitoring this metric will give you a fair idea of the level of fragmentation that has occurred within your Redis server and can indicate inefficient memory consumption if the value is higher.
Connection statistics
As a database administrator, keeping a close eye on the number of connections handled by the Redis server is important, as it majorly contributes to the server’s load. The more clients connected, the higher the load handled by the Redis server, which may affect its responsiveness if not taken care of.
Since Redis is known for its fast-paced data storage, message broker, and caching capabilities, a surge in the number of clients connected to the server can occur almost instantly. Obtaining a clear overview of the number of connections established with your Redis server with detailed stats on the individual connections split-up can help you to quickly identify the metrics with the surge in values and take necessary corrective steps.
Below is the list of connection metrics you should monitor:
- Connected clients: Indicates the number of clients that are connected to the Redis server.
- Blocked clients: Indicates the number of clients that are pending on a blocking call by the Redis server.
- Rejected connections: Indicates the number of clients that are rejected by the Redis server because of the maximum client connections limit.
- Commands processed per second: Refers to the number of commands that are processed by the Redis server per second.
Message broker statistics
Apart from the data storage capabilities, Redis is also used for its messaging broker features and makes use of publish/subscribe (pub/sub) messaging model to send and receive messages via channels and patterns. Keeping track of the channels and patterns used in the pub/sub messaging model of your Redis server is important to manage communication in business applications with event-driven architectures.
Database activity statistics
Keeping track of database activities is the most crucial aspect for database administrators when it comes to Redis. A large number of database calls are made to the Redis servers for data storage and retrieval on a regular basis for day-to-day business operations.
Since Redis is popularly known for its message broker, caching, and data store mechanisms, even the slightest failure in the data storage and retrieval mechanism can cause major havoc in the business performance depending on it. This is why keeping a constant eye on Redis’ database activities can eliminate the room for database failures well in advance and can save database admins from unexpected performance bottlenecks.
Below are the list of connection metrics to be monitored:
- Successful key lookups: Refers to the number of successful lookups of keys in the main dictionary of the Redis server.
- Failed key lookups: Refers to the number of failed lookups of keys in the main dictionary of the Redis server.
- Evicted keys: Indicates the number of keys that are removed due to memory constraints from the Redis server.
- Expired keys: Indicates the number of keys that are expired based on the time to live (TTL) value specified for the Redis server.
Replication details
One of the major requirements of database management systems is to perform timely replication activities for data integrity and availability. Redis takes care of syncing data from the primary Redis server to all the required secondary Redis servers, ensuring data consistency across all the replicas in the system for avoiding possible data losses due to server outages.
Monitoring the replication process in Redis is crucial to maintain optimal performance and stability of your Redis servers. Key metrics to watch out for include replication role, master host, and the number of secondary connections.
Persistence details
In addition to configuring replication for your Redis servers, enabling persistence for your Redis servers is equally important, as it serves as a safety net in cases of unprecedented server failures. While there are different persistence options to accommodate various use cases, keeping a close eye on the persistence status of those options alongside your replication metrics is crucial for your Redis servers during unexpected failures.
The key metrics to watch out for with respect to persistence include the details about Redis databases (RDB) and append-only files (AOF) persistence states, like the status of the last RDB save operation; the status of the AOF rewrite operation; and database stats such as the database name, number of keys, and the number of expired keys. Gaining a clear idea of these metrics can help you a lot in times of disaster recovery.
Boost your Redis server performance with a top Redis monitoring tool
Overall, monitoring Redis is essential for ensuring the health and performance of your database system. By tracking key metrics related to Redis performance such as CPU/memory usage, connections, message brokers, database activity, replication, and persistence, you can proactively identify and address any potential issues before they impact your application’s performance. Applications Manager provides a comprehensive solution for Redis monitoring, allowing you to gain valuable insights into the performance of your database and optimize its efficiency.
Don’t wait until a performance issue arises to start monitoring your Redis instance. Download a 30-day, free trial of Applications Manager today and take control of your database’s performance. With real-time monitoring and alerting capabilities, Applications Manager can help you proactively manage your Redis system and ensure that your applications are running smoothly. Start monitoring your Redis instances now and stay ahead of potential performance issues.

About the author: Arshad Shariff is a technical content writer at ManageEngine, a division of Zoho Corporation. He actively contributes to content on the application performance monitoring domain within the IT Operations Management suite. He delivers content through user guides, blogs, articles, and webpages that are simple to comprehend for readers with ease.


