As one of the most widely used scripting languages for web development, PHP is known for its flexibility and ease of use. However, with complex applications and increasing traffic, PHP performance can sometimes take a hit.
Monitoring PHP performance and diagnosing bottlenecks is essential to ensure that your web applications are running smoothly and efficiently. In this blog post, we will explore several strategies for monitoring PHP performance, identifying bottlenecks, and optimizing your code.
Table of Contents
PHP Performance Monitoring & Profiling

Monitoring PHP performance starts with enabling and configuring the right tools. It goes beyond the basic overview-type monitoring provided by command line tools such as top, htop, and btop.
There are several more sophisticated performance monitoring solutions available that are specifically designed for PHP. Here are a few popular options:
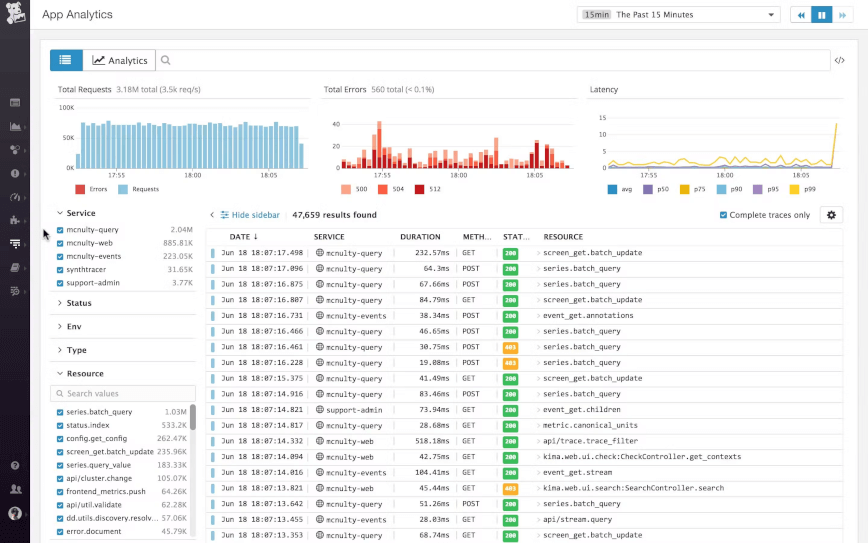
- Datadog allows you to track PHP performance metrics and visualize them in customizable dashboards.
- ManageEngine can monitor PHP performance and evaluate the end user’s experience using their PHP APM monitoring agent.
- New Relic: offers PHP-specific monitoring features, providing insights into the performance of your web applications.
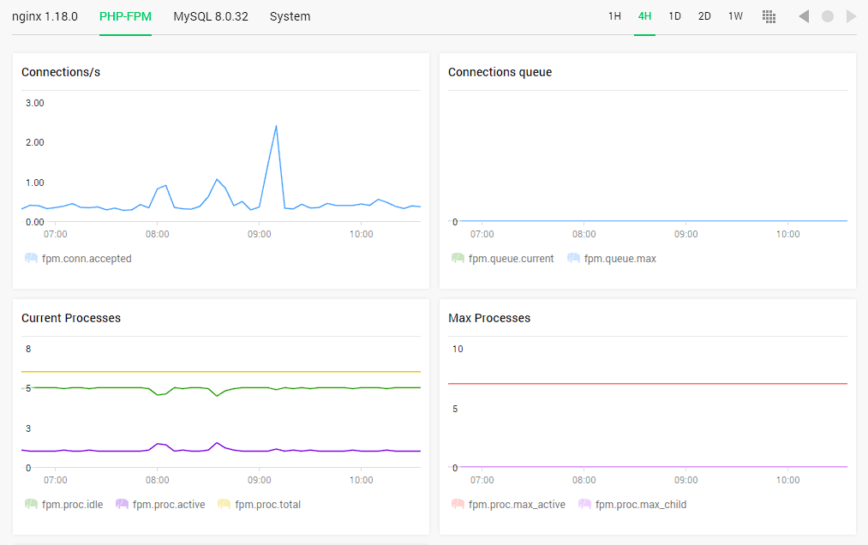
- Nginx Amplify (above screenshot) can collect many useful metrics, including slow queries.
- browse more solutions…
In addition to monitoring, profiling your PHP code allows you to pinpoint performance issues and optimize your application. Here are a few popular options:
- Appdynamics profiling collects data to help identify slow functions or methods, inefficient loops, and other bottlenecks.
- Blackfire can profile, test, and continuously optimize PHP code performance.
- Tideways is a cloud-based application performance monitoring and profiling tool for PHP applications.
- Xdebug offers a profiling feature that measures the execution time and memory usage of your PHP scripts.
- Zend Server is a PHP application server that includes a built-in profiler.
Analyze PHP Performance Metrics

With PHP performance monitoring in place, analyzing the collected metrics is an essential step in identifying and resolving performance issues in PHP applications. By measuring key performance indicators such as CPU utilization, memory usage, and response time, developers can pinpoint bottlenecks and optimize code for better performance.
CPU usage
High CPU usage can indicate that a PHP application is working harder than it needs to, which can lead to performance issues and slow response times. Monitoring CPU usage is important for optimizing the performance of PHP applications.
By tracking CPU usage over time, developers can identify areas where their code is consuming excessive processing power and take steps to optimize their code.
Memory usage
Increased memory consumption may result from memory leaks, inefficient data handling, or caching issues. Memory leaks are a common performance issue in PHP applications that can cause significant problems if not addressed.
A memory leak occurs when a PHP application allocates memory but does not release it, leading to a gradual depletion of available memory over time. This can cause your application to slow down and even crash.
Response time
This refers to the amount of time it takes for a PHP application to respond to a user request, from the moment the request is received to the moment the response is sent back to the user’s browser.
Monitoring response time is important for ensuring that PHP applications are delivering fast and responsive user experiences. Slow response times can lead to frustrated users, lower engagement, and decreased conversions.
Implement PHP Caching Strategies

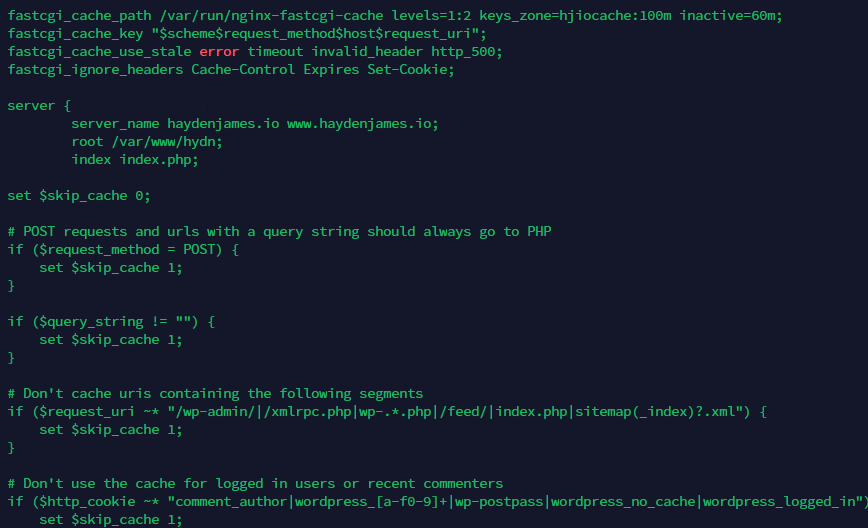
Nginx FastCGI cache is being used on this blog for HTML page caching.
Caching is a powerful technique to improve PHP performance. By caching frequently accessed data or query results, PHP applications can reduce the number of database queries and speed up page load times, resulting in a better user experience. Consider implementing the following caching strategies.
OpCode caching
OpCode caching stores precompiled PHP bytecode in memory, reducing the overhead of repeatedly interpreting PHP scripts. Since PHP version 5.5, opcode caching is included and enabled by default in PHP. Opcode caching can significantly improve the performance of PHP applications by storing compiled code in memory, reducing the need for repeated parsing and compilation of PHP scripts.
Edit: Stfcfanhazz and Penguinpie correctly pointed out that I didn’t mention preloading. Opcache preloading is a feature introduced in PHP 7.4 that allows you to load PHP files into the opcode cache during the PHP engine initialization phase, which can improve the performance of your PHP application. In addition, the Inheritance Cache feature was added in PHP 8.1.
Object caching
Object caching is a technique used to store frequently accessed objects in memory to reduce the need for repeated, expensive operations or database queries. By caching objects in memory, PHP applications can improve performance and reduce response times.
Caching can be implemented using a caching layer between the application and data sources, such as Memcached or Redis. These solutions provide a range of features, including distributed caching, object serialization, and expiration times, and can be configured to suit the needs of different PHP applications.
Page caching
Page caching is a technique used to improve the performance of web applications by storing the HTML output of a page in cache, allowing it to be served directly from memory instead of generating the page from scratch every time a user requests it. This can significantly reduce the load on the server and improve response times, especially for frequently accessed pages.
Nginx FastCGI cache is a caching solution that works with Nginx. Nginx FastCGI cache allows you to cache the response of a FastCGI application, such as a PHP, in memory, reducing the number of requests made to the application server as well as drastically reducing response times.
Optimize Database Queries
Use proper indexing
Indexing is a technique used to improve the speed of database queries by creating a data structure that maps values in one or more columns to their corresponding rows in a database table. Using proper indexing is a best practice for optimizing the performance of database queries in PHP applications.
By properly indexing the columns used in database queries, developers can significantly improve the performance of their PHP applications. When a query is executed, the database uses the index to quickly locate the relevant rows, reducing the need for expensive full-table scans.
Optimize queries
In addition to indexing, optimizing queries is the process of improving the performance of database queries by making them faster and more efficient. This can be done by query tuning, data normalization, caching, and partitioning large tables. Analyze your SQL queries to identify any inefficiencies and optimize them to reduce execution time.
For example, employing tools such as Percona Monitoring and Management (PMM) – an open-source database observability, monitoring, and management tool for MySQL, PostgreSQL, and MongoDB.
Utilize caching
Implement caching mechanisms to store the results of frequently used queries and reduce database load.
Database caching can be used to improve database query performance by utilizing buffer cache, table cache, thread cache, and key cache. This can greatly improve query performance and scaling.
Upgrade to PHP 8!

…upgrade to PHP 8!
Upgrading to PHP 8 is important for several reasons. It brings significant improvements in performance by optimizing memory usage, reducing CPU usage and improving execution times. This can result in a faster and more efficient website or application.
PHP 8 has enhanced security features, including the newly introduced JIT compiler that provides protection against vulnerabilities like buffer overflows and null pointer dereferences. PHP 8 has an improved error-handling system that makes it easier to identify and fix issues in your code.
PHP 8 introduces new features and syntax like attributes, match expressions, and named arguments that can help you write more concise, readable, and maintainable code. By upgrading, you can take advantage of these improvements and stay up-to-date with the latest developments in the PHP ecosystem.
Conclusion
In previous articles, we took a quick look at PHP-FPM, reducing process manager (PM) overhead and maxing out PHP-FPM’s throughput by attempting to keep processes in memory using pm.static.
However, as discussed in this article, we also want to drill down into all services and components called up by each user’s interaction on our production servers. This allows us to diagnose PHP and other apps for performance bottlenecks, trends, and errors. Did I miss your go-to PHP monitoring solution? Browse the 50 Top Observability & APM Solutions.
Monitoring PHP performance and diagnosing bottlenecks is an ongoing process that requires a thorough understanding of your application and the tools at your disposal.
By leveraging performance monitoring tools, analyzing key metrics, profiling your code, optimizing database queries, and implementing caching strategies, you can significantly improve the performance and health of your PHP applications, ensuring that they run smoothly and efficiently!


