

Let’s pick up right where Part 1 left off: pfSense Firewall Appliance Unboxing. This isn’t a quick-start guide. It’s my logbook from weeks of fine-tuning pfSense. Weeks, not years, so follow along and let’s learn and improve our pfSense configs together. In this article, I share my pfSense setup: network interfaces, firewall rules, pfBlockerNG, Suricata, the works. Basically, this is a dump of my journey in finding the best pfSense settings that work for me.
It’s my first time using pfSense, but I’ve managed various firewalls on Linux servers over the years. By sharing my config, I hope to welcome corrections, suggestions, and to help readers who are just getting started with pfSense.
The main goal here that we configure a secure pfSense firewall setup that survives ISP hiccups while providing added visibility into what’s going in and out of our home lab, home office, or small business networks. You know, peace of mind, all while being interesting!
In This Article
pfSense Hardware & Prep

Photo of my current home lab. A work in progress.
If you haven’t settled on a firewall appliance yet, check out my unboxing write-up first (Part 1): Intel N100 CPU, 82599ES 10G SFP+ NIC, and i226-V 2.5G ports give you plenty of headroom while keeping power under 15W at idle. Note that some links below point to Amazon, where I earn a small amount on qualifying purchases, while other links direct you to manufacturer or product pages and other related resources that I’ve found useful during my pfSense firewall setup.
Choosing pfSense hardware
There are a host of hardware options available. I’ve filtered some of the best pfSense hardware options, that you can currently find on Amazon, as well as eBay.
RAM is cheap, around $15 to $20; start with at least 4 GB if you intend to run Suricata and pfBlockerNG concurrently. Then drop in a 128 GB NVMe for $20 for fast storage.
In my case, I’m using a 256 GB TEAMGROUP MP33 that I purchased back in 2022. Full parts list and thermals are in the unboxing post: My $300 pfSense Firewall Appliance – Part 1: Unboxing.
10G Uplink Options: Cat6, Fiber or DAC?

For connecting the 10G SFP+ port from my pfSense box to my TP-Link SG2210XMP-M2 switch, I went with a pair of 10GTEK 10GBase-SR SFP+ LC Transceivers and a 7 inch OM4 Fiber LC to LC cable. My main ISP uses not one, but two devices for internet connection: their Fiber ONT device and a modem-router device. I managed to delete the router, and I’m now waiting on an ONT stick in order to direct-connect the fiber to my pfSense box.
Here’s a comparison of your options for connecting via SFP+:
- Plain CAT 6a, plug and play 10GBase-T modules convenient, but dissipate up to 5 watts, so they run pretty hot. Keep the hop under 15 meters, or you’ll pay in heat as you get closer to 30 meters.
- Passive DAC (Direct Attach Copper) twin-ax is the cheapest way to connect a 10 Gb link inside the rack (up to ~7 m). It’s essentially two SFP+ ends bonded by copper; no optics, <0.5 W, not much heat generated.
- Fiber (LC multimode, 10 G SR optics) breezes past 30 m connections, laughs at EMI (Electromagnetic Interference) and lowest power at ~ 1 W. Two SR modules plus a short OM4 patch cable usually cost less than a pair of RJ-45 10GBase-T transceivers.
| Type | 10GBASE-T SFP+ (RJ-45) | Passive DAC SFP+ | Fiber SFP+ (SR) |
|---|---|---|---|
| Max Distance | ≤ 30 m (Short RJ-45 runs) | ≤ 7 m (Intra-rack) | 300 m (Long or EMI-prone runs) |
| Power Draw | 2 to 5 W | < 0.5 W | ~ 1 W |
| Heat | Moderate (needs airflow) | Minimal | Low |
| Cost (pair) | Moderate | Lowest | Moderate |
| EMI Immune? | No | No | Yes |
| Recommended Model | H!Fiber 10Gb Transceiver | 10Gtek SFP+ DAC Twinax | 10GTEK 10GBase-SR |
Removing my ISP’s ONT (Optical Network Terminal)

Rest in peace, ISP router. An electricity leach @ ~20 watts.
As mentioned above, I was able to get rid of the ISP’s modem/router box and plug the RJ-45 cable from the ONT directly into my second SFP+ port on the pfSense firewall. I did this by spoofing the mac address of the ISP device and then cloning the PPPoE connection. The PPPoE config was not visible in the UI of the device, so I had to download the config using the UI’s backup feature and found everything needed in the exported text config file.

Hopefully, the GPON stick works so I can unplug this ONT and save ~10 watts.
The ONT is already set to pass-through mode, so it’s solely there to terminate the fiber. PfSense is already handling connecting to my ISP. Mainly, now, it’s just a waste of electricity and an additional failure point. But first, I’ll need a GPON stick. I just ordered one on eBay for $20 (while writing this they cancelled my order and said due to shipping and taxes I have to pay $35).
Please check your specific ISP requirements, but here’s an comparison of GPON SFP modules specific to my setup for ONT delete (sometimes called an “ONT-stick”, “mini-ONT” or “PON-stick”):
| Model | Chipset | Connector | Notes |
|---|---|---|---|
| Sercomm FGS202 | Lantiq PEB98036 | SC/APC inside SFP shell | Same vendor as my FG1000R; already built to talk GPON OLTs with Sercomm profile. |
| FS GPON-ONU-34-20BI | Broadcom B+ class | LC/UPC | Lets you spoof/clone LOID/SN via CLI; widely documented. |
| Nokia G-010S-A / G-010S-P | Broadcom | SC/APC | Works on many Huawei/Calix OLTs after the ISP whitelists the module’s serial number. |
| Ubiquiti UF-Instant | Realtek | LC/UPC | User-friendly web UI, but some OLTs reject non-Broadcom sticks. |
pfSense Installation

I’m not going into great detail. Because the installation process is pretty simple. However, I will include a few tips and comments.
BIOS and booting checklist
These were my settings for my n100 (fan disabled) pfSense install. The N100 is overkill for most setups. But it’s cheap, runs cool and very well proven with lots of online documentation, and discussions specific to pfSense:
- Secure Boot: disable it because it blocks the booting pfSense.
- Restore power on AC Power Loss: Set to ‘Power On’ so that pfSense will automatically boot when power is restored after a power loss.
- Fan profile: choose “Balanced” or “Off” for CPUs like the N100 which run really cool. Also see: N100 Fans Don’t Turn Off. If all else fails, you can unplug the fan.
- Boot delay: Still in system BIOS, don’t remove the default 3-second pause! Keeping this allows the hardware a little extra breathing room to fully initialize before pfSense begins probing interfaces. If you remove the BIOS boot 3-second delay, NICs sometimes aren’t 100% ready, kernel sees up/down flapping events, pfSense triggers package/service restarts, and it results in slower problematic startups. I experienced this first hand, so sharing.
- Reduce or remove pfSense boot delay: On the other hand, this IS safe! Use either the System → Advanced → System Tunables or manually create
/conf/loader.conf.localwith:autoboot_delay="-1"to remove completely orautoboot_delay="1"to reduce delay to 1 second. - With these settings, rebooting takes ~ 60 seconds, even with IDS/IPS packages installed.
Grab a clean image
- Head to Downloads ▸ pfSense CE and pull the latest amd64 ISO.
- Verify it before you touch a USB key:
sha256sum pfSense-CE-*.isoCompare against the SHA-256 string on the download page; mismatches mean re-download.
Write the installer to a USB
I used balenaEtcher.
You can also use Linux CLI:
sudo dd if=pfSense-CE-*.iso of=/dev/sdX bs=1M status=progress && sync
Replace /dev/sdX with your flash-drive path.
On macOS use balenaEtcher or sudo diskutil unmountDisk /dev/diskN then dd.
Windows users: balenaEtcher or Rufus.
Boot and run the pfSense installer
- Insert the USB, hit your board’s boot menu, choose the USB device. (Walkthrough)
- At the pfSense splash, accept defaults → Install → keymap (your language)→ filesystem *ZFS**.
- Reboot when prompted; remove the stick.
Complete the first-boot wizard
Ten Things to Change Right After pfSense Install
1 — Secure the WebGUI straight away
Note: By default, pfSense isn’t reachable outside of your LAN. However, it’s still a good practice to make this change, in the event that pfSense gets unknowingly exposed someday.

Straight after the installation, head to System → Advanced → Admin Access. Switch the webConfigurator to HTTPS and, in the TCP port box, use a non-standard port anything high and random works.
That single change does two things: it encrypts every login session and keeps casual scanners from spotting your firewall on the popular default port 443.
2 — Leave SSH turned off (or harden it if you really must switch on)

Still on System → Advanced → Admin Access, scroll down to Secure Shell.
If you have a good reason to check Enable Secure Shell, set SSHD Key Only to Require both Password and Public Key, and choose a non-standard port instead of the default port 22. That gives you an encrypted back-door for maintenance while sheltering the daemon from the endless credential-stuffing noise that targets port 22. Ideally, keep SSH disabled!
3 — Tighten Login Protection
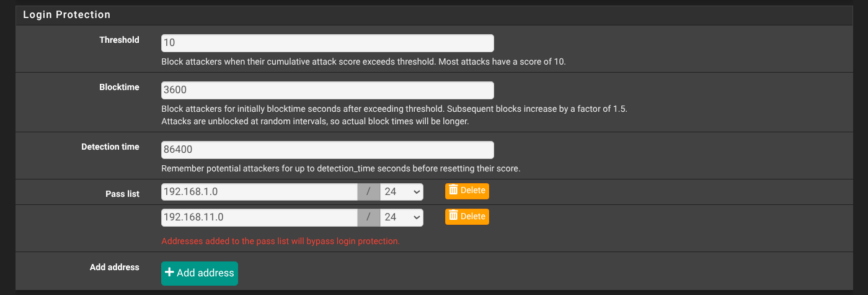
Yet aagain,on the System → Advanced → Admin Access page, scroll to Login Protection and harden the values. Shown in the screenshot above are my recommended settings: threshold 10, block-time 3600 seconds, detection window 86400 seconds, with at least your internal subnets in the pass-list. These settings lock out an IP for an hour after a bad login attempt, while letting trusted LAN ranges bypass the check.
Of course, like my setup, your pfSense won’t be available via any public ports by default. However, it’s still a best practice to have these settings in place, in the event that pfSense gets unknowingly exposed.
4 — Disable the built-in “admin” user and create your own

Under System → User Manager → Users, click Add to create a new account with a non-obvious username, a strong password, membership in the admins group, and no shell access.

Next, edit the default admin user, tick This user cannot login, and save. From now on, you’ll manage the firewall through that new user only. If you ever need console work, briefly re-enable the original admin account, finish your task, and disable it again.
5 — Switch the DHCP backend to Kea early on
System → Package Manager → Available Packages → Service_Watchdog
Suricata, pfBlockerNG, Wireguard, and OpenVPN are all great, until one of them crashes at 3 a.m. Unbound stopped on my pfSense yesterday after I restarted Suricata and pfBlockerNG. The Watchdog package polls selected services every minute and restarts any that aren’t running. A tiny safety net that costs almost no resources but saves a midnight drive home (or office) to the rack.
With that, you’re now ready to dive into pfSense configuration! Let’s move on to the pfSense configuration settings.
pfSense System settings walkthrough

Let’s begin from left-to-right in the navigation bar at the top of the pfSense UI. Starting with the ‘system‘ menu. The first drop-down on the pfSense navigation bar. This is where you tell the firewall who it is, how it keeps time, which DNS servers it trusts, and how you, and only you, get through the admin door.
A couple of minutes in General Setup and Advanced locks the GUI behind HTTPS on a quiet port, routes all look-ups through a filtered resolver, and enables the CPU’s AES instructions so every future VPN or TLS handshake runs at full speed. Many of these essential settings we already covered in the previous section.
Moving on, the same menu also houses the day-to-day plumbing: extra packages, user accounts, and the gateway group that lets the box fail over ISPs without dropping a beat. Configure these early and every setting that follows—DHCP scopes, IDS/IPS, even the dashboard graphs, inherits a clean, trusted baseline. Below is an overview of my settings.
General Setup
- Hostname / domain:
hostname.hydn.devties local services and to my personal namespace. - Timezone:
America/St_Kittskeeps log time-stamps square with your location. - DNS servers: Quad9 primary/secondary
9.9.9.9 / 149.112.112.112. Quad9 DNS blocks malware, phishing, spyware, and botnets. You can also use Cloudflare’s DNS. - NTP pool:
time.cloudflare.comfollowed bytime.google.com.
Advanced (System → Advanced)
- WebGUI hardening: GUI is HTTPS-only on non-standard port, autocomplete disabled and an alternate host list (
myaccountname.cloudflareaccess.com) for Cloudflare Zero-Trust can front-end it while keeping WAN ports closed. - GUI certificate: Presented cert is GUI default a self-signed RSA created at install.
- SSH access: Disabled but when enabled is also on non-standard Port, key-only auth. SSHGuard blocks a source after x bad logins for x hours (tweak to your preference).
- Hardware tweaks: AES-NI crypto enabled, thermal set to Intel, and NAT reflection is pure-NAT.
SMTP notifications
System > Advanced > Notifications: The system is set up to send mail (notifications) using my Postmarkapp account on TLS with my unique token.
User Manager
- admin (uid 0) is the built-in root with shell access, login disabled.
- myusrname is the day-to-day admin account, member of admins but without a shell for extra safety.
Package Manager
My installed packages:
- pfBlockerNG-devel: IP blocking and DNS geo and content filtering with DNSBL.
- Suricata: IDS in IPS-inline mode on WANs, alert logs pruned after 14 days.
- Cron: A package to apply and maintain custom and recommended system patches.
- System_Patches: A package to apply and maintain custom and recommended system patches.
- Watchdog: Monitors for stopped services and restarts them.
Routing
Network Interfaces config — Assignments, VLANs, and WAN links
Physical layout follows function

Read more about this box: My $300 pfSense Firewall Appliance – Part 1: Unboxing
The 10G port ix1 carries both management (tag 1) and guest (tag 3) traffic to the 10G SFP+ port on my multigig switch, where eight 2.5 Gb ports fan out to my IoT hardware (with some unused for future expansion).
For internet, ix0 tags VLAN 20 for the fiber ISP’s PPPoE hand-off, while igc3 (ETH3) keeps a DHCP cable link as fail-over; pfSense lumps them into a Multi_ISP gateway group so latency or packet-loss flips routes automatically. A NordVPN tunnel shows up as ovpnc1, giving policy-based routing the same knobs as any WAN. This is handy for pushing only the IoT VLAN through a privacy exit without floating-rules.
From here, firewall policies, DHCP scopes, and IDS sensors slot into place:
| Interface Assignments | Physical port | Type | IPv4 / Mask | Role |
|---|---|---|---|---|
| WAN1_FIBER (ix0 fiber) | pppoe0 → ix0.20 | PPPoE on VLAN 20 | Dynamic | Primary ISP (fiber) |
| WAN2_Coax | igc3 | DHCP | Dynamic | Backup ISP (cable) |
| VPN_NORD | ovpnc1 | OpenVPN client | — | NordVPN for VLAN3 |
| L0_ADM | igc0 | Static IPv4 | 192.168.11.1/24 | Admin-only LAN |
| L1_WIN | igc1 | Static IPv4 | 192.168.4.1/24 | Windows devices |
| L2_LAB | igc2 | Static IPv4 | 192.168.2.1/24 | Home-lab devices |
| VLAN1 (ix1 fiber sw uplink) | ix1.1 (tag 1) | Static IPv4 | 192.168.1.1/24 | Wired & Wi-Fi LAN |
| VLAN3 (ix1 fiber sw uplink) | ix1.3 (tag 3) | Static IPv4 | 192.168.3.1/24 | Guest Wi-Fi / IoT devices |
Why this layout works for me
- Clear separation – each security zone (admin, lab, IoT/guest) has its own Layer-3 interface, so stateful rules can isolate or allow traffic precisely where I need.
- 10 Gb trunk –
ix1carries both management VLAN 1 and guest VLAN 3 to my 10 GB switch, which has eight 2.5 GB LAN ports. - Dual-WAN resilience – fiber ISP (Tier 1) and cable ISP (Tier 2) are fed into a gateway group Multi_ISP that fails over on loss/latency; pfSense sets that group as the IPv4 default route.
- Clean PPPoE – the FTTH provider requires VLAN 20 in order to replace their modem device; tagging happens on
ix0.20, then PPPoE createspppoe0. - VPN as an interface – having NordVPN on
ovpnc1lets me make policy-routing and NAT rules just like any other WAN, instead of having to use floating rules.
Firewall — Aliases, NAT, pfBlockerNG, Rules
The Firewall menu is where the design you mapped out in Interfaces turns into concrete, enforceable policies. I started by building a list of aliases—IP, network and port groups. With names such as Ring_Cams or Web_TCP, a single edit later can ripple through dozens of rules without hunting for scattered addresses.
Because a Cloudflare Tunnel fronts the primary WAN for the hydn.dev website, Checkmk, the Unifi controller, the network switch, remote printing and other services, inbound NAT is almost nonexistent; the box handles only a pair of port-forwards on the backup WAN2, restricted to specific allowed ports and IPs.
Aliases – the Lego-bricks for firewall rules
Windows, Web browsing, Security/IoT bundles such as Ring, Unifi doorbell, cams, APs, controller.RFC1918 networks, DoT IPs/ports, CheckmkPingdom Probes IPs, Cloudflare IPv4 ranges, pfBlockerNG auto-generated listsAdding and organizing Aliases pays dividends later when you need to make changes.
NAT (Network Address Translation)
As mentioned I’m making use of Cloudflare Tunnels via Zero trust. So my front facing ISP WAN1 has all incoming ports closed and firewall rules set to drop all unsolicited incoming traffic. Check/test your with routersecurity.org.
Port-forward snapshot
On WAN2, Two port forwarding rules expose Checkmk server which runs on a VM on Win 11 ThinkCentre-M75 box (192.168.4.109) to the alias cmk_hosts (access restricted to this IP list):
pfBlockerNG – layered threat-feed defense
Firewall Rules
IPv6 traffic is globally blocked on all interfaces silently to reduce logs/noise. pfBlockerNG rules sit at the top and my custom rules follow. As an example, here are a few screenshots of my rules. Suggestions welcomed:
Services — DNS Resolver, DHCP and NTP
The Services menu is where the box acts like the nervous system of the network: handing out IP leases, resolving names, and keeping everything in sync. It’s here that we lean on three core daemons:
-
DNS Resolver (Unbound): for encrypted, policy-aware name look-ups.
-
DHCP Server (kea-dhcp4): to parcel out addresses and gateways.
-
NTP (ntpd): so logs and certificates all agree on the same timeline.
The goal is to keep each one as simple as possible while still gaining the speed of local caching, the convenience of per-VLAN pools, and the reliability of good time.
DNS Resolver (Unbound)
Unbound is running and bound to all interfaces for both listening and outgoing queries. You only need two DNS server entries (a pair), add a third DNS provider if worried about DNS outages, which are extremely rare for both Cloudflare and Quad9. Cloudflare offers lower latency than Quad9, while Quad9 offers better malware blocking and privacy.

Note, you must also set your DNS IPs AND hostnames in System > General Setup:
DHCP Server (kea-dhcp4)
Kea DHCP4 manages DHCP for the following pfSense interfaces:
| Interface | DHCP Pool | Notes |
|---|---|---|
| Admin (LAN 0) | 192.168.11.100 – 192.168.11.150 | Management devices |
| Windows (LAN 1) | 192.168.4.100 – 192.168.4.150 | Desktops / VMs |
| Home Lab (LAN 2) | 192.168.2.150 – 192.168.2.200 | Home-lab VLAN-aware (ex. Unifi Controller) |
| VLAN 1 (Trusted LAN + Wi-Fi) | 192.168.1.100 – 192.168.1.200 | 10 Gb back-bone (ix1) |
| VLAN 3 (Guest Wi-FI SSID/IoT devices) | 192.168.3.20 – 192.168.3.200 | Guest Wi-Fi & cameras (ix1) |
My NTP settings
Services — Suricata
Packet In
↓
pfBlockerNG
• IP & GeoIP feeds/tables
• DNSBL filters (DNS query level, not packet level)
↓
Suricata Inline
• Signature matching (ETOpen, Snort GPLv2 rules)
• Automatic SID management (drops, disabled rules)
↓
pfSense Firewall Rules
• Drop all IPv6 traffic
• Interface Pass / Drop / Reject rules
↓
IPv4 deny• Drop all remaining IPv4 packets.
")


")


