What if your servers crashed during your biggest sales event of the year? For enterprise IT leaders, that’s not a dramatic opening it’s a recurring risk. A few minutes of downtime can stall transactions, damage customer trust, erode brand reputation, and drain revenue at an alarming rate. With modern applications running across hybrid clouds, distributed microservices, and third-party APIs, even a small failure can trigger a business-wide outage.
This is why server health is no longer an IT hygiene activity it’s a mission-critical business strategy. In this blog, we’ll break down best practices for monitoring server health at enterprise scale, show where teams typically fall short, and highlight real-world scenarios where the right monitoring tools helped prevent major disruption.
In This Article
The five pillars of enterprise server health monitoring
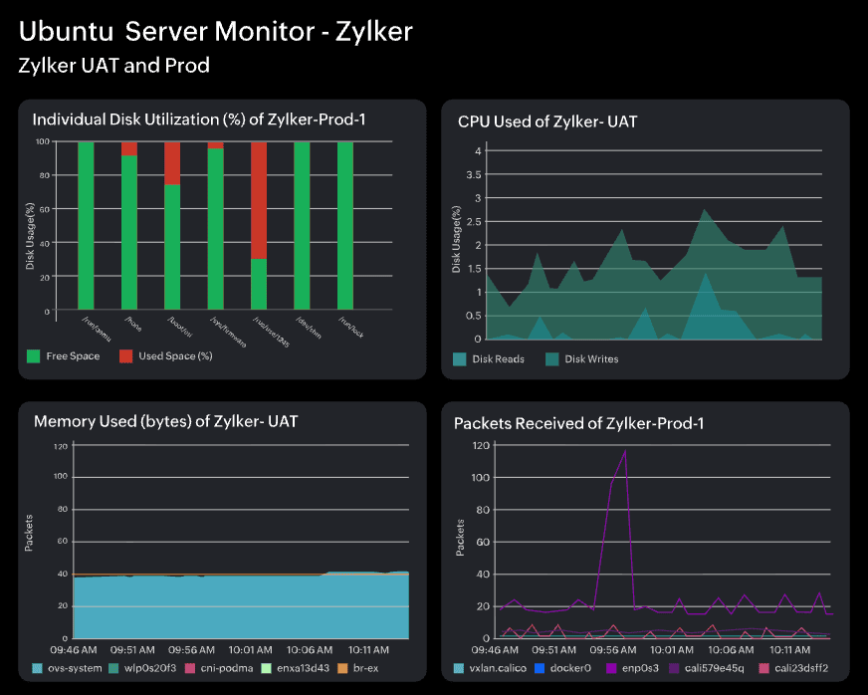
Healthy servers don’t happen by accident. They require constant visibility into core indicators like CPU utilization, memory performance, disk usage, and network throughput. When monitored proactively, these signals help IT teams spot early warning signs, respond before users feel the impact, and avoid costly failures. For today’s enterprises, where servers underpin everything from customer apps to internal systems, downtime is more than an inconvenience; it’s a direct threat to revenue and reputation. Regular server health checks ensure performance stays stable and business operations stay protected.
1. Monitor critical resource signals continuously

Enterprises running SaaS applications should closely monitor CPU and memory utilization in real-time to ensure balanced resource allocation.
For SaaS-heavy enterprises:
- Sustained CPU pressure indicated by high utilization alongside rising run queue depth or CPU steal time often precedes latency issues.
- Persistent increase in process-level or cgroup-level memory use, especially when unreclaimed by the kernel, can signal memory leaks in microservices.
- Spikes in disk I/O or IO wait may stem from log growth, database write amplification batch workloads or filesystem overhead.
When monitored continuously, these metrics reveal patterns that help engineers fix issues before they become outages.
2. Set up alerts and automated corrective actions
In enterprise environments, particularly in finance, disk pressure builds fast as logs, transactions, and temporary files accumulate. Intelligent alerting systems monitor not only static thresholds but also rate of change, IO performance, and file-system health. When disk capacity begins trending toward saturation, the monitoring platform can notify the appropriate team. It can then trigger controlled workflows such as archiving old logs, freeing space, or provisioning additional storage based on policy and filesystem awareness to prevent disk exhaustion. By tying alerts to action, enterprises reduce MTTR and avoid performance degradation long before end users notice.
3. Conduct capacity planning with data-driven forecasting
Real-world enterprise workloads rarely grow linearly, as factors such as traffic surges, seasonal demand, product launches, batch processing, and data retention all contribute to unpredictable peaks. By analyzing historical performance metrics, CPU saturation patterns, memory pressure, disk growth trends, and network throughput during prior events, IT teams can model likely future loads rather than guessing. Capacity planning tools can forecast likely resource needs and suggest or schedule provisioning actions before demand spikes occur. This might include autoscaling VM pools, pre-warming container clusters, shifting workloads geographically based on demand patterns, or allocating buffer capacity to critical services.
By forecasting rather than reacting, enterprises avoid resource starvation, maintain application responsiveness under stress, and ensure that business-critical periods, such as major sales events or financial quarter closes, run without disruption.
4. Monitor network traffic and flow behavior

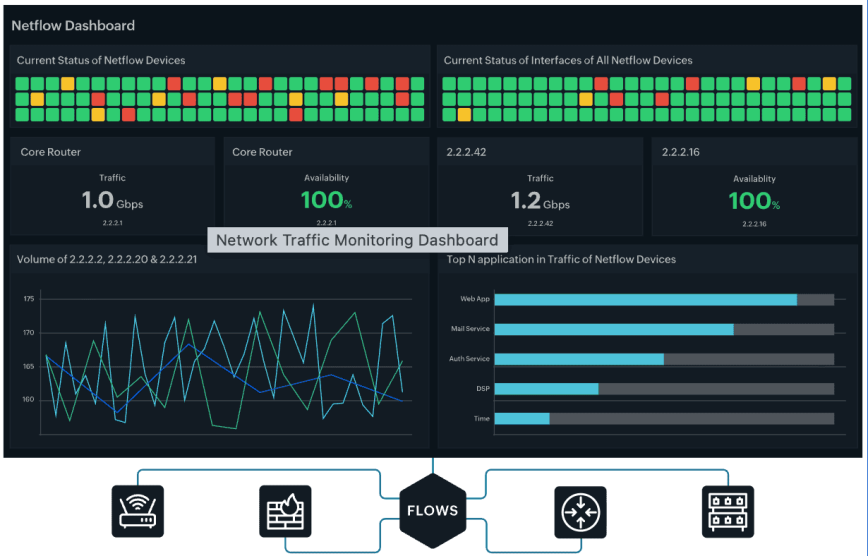
In enterprise environments, especially hybrid networks spanning data centers, cloud regions, and remote sites, network strain can escalate quickly as user sessions spike and east–west traffic surges between application components. Continuous monitoring of throughput, latency, packet loss, retransmission rates and interface or SoftIRQ saturation provides early warning of congestion or failure.
Modern platforms surface flow-level insights, with network traffic monitoring helping teams pinpoint noisy endpoints, unexpected traffic sources, or saturation on specific interfaces. Alongside this, network configuration management (NCM) ensures that device changes, drift, or misconfigurations do not silently degrade performance or weaken security.
When performance dips or suspicious patterns appear, automated actions such as rerouting workloads, rate limiting chatty systems, scaling load balancers, or isolating affected nodes keep critical services reachable while operations teams remediate root causes before they turn into business-impacting outages.
5. Leverage event correlation and dependency-aware monitoring
As enterprise environments scale across data centers, cloud platforms, and container clusters, isolated alerts provide little value without context. Event correlation platforms continuously analyze signals from logs, metrics, traces, infrastructure events, and application telemetry to group related symptoms into a single incident. It helps teams group related symptoms and narrow probable causes instead of chasing isolated alerts.
Dependency mapping adds another layer of clarity by visualizing how services, databases, APIs, virtual machines, and network components interact. When a database stalls or a compute node saturates, downstream services tied to that component can be identified immediately, enabling faster triage.
When paired with intelligent automation and ITSM workflows, correlated events can trigger runbooks, initiate failover, scale capacity, or notify the right teams based on impact. By providing unified visibility into how systems behave as an interconnected whole, dependency-aware monitoring allows IT teams to resolve issues before customers notice and maintain resilience during unpredictable demand surges.
Boosting server health for modern enterprises
Server health monitoring is no longer a background task or a once-a-day checklist. With IT environments becoming increasingly interdependent and complex, performance issues can emerge anywhere, whether from a CPU spike, a noisy container, a misconfigured network device, or a cascading dependency failure. Enterprises that take a proactive approach to visibility, alerting, capacity planning, traffic monitoring, and event correlation place themselves in a stronger position to absorb demand, maintain reliability, and protect user experience.
With the right practices and tooling discipline, IT teams can spot degradation early, shorten resolution times, and prevent isolated resource constraints from becoming customer-facing outages. Ultimately, investing in server health is an investment in business continuity, operational efficiency, and the ability to scale confidently through the next surge in demand.


