
If the Linux desktop and applications on your thin and light laptop or low-end PC feel sluggish under a busy session, the usual suspects are slow storage R/W, not enough RAM, or occasionally a CPU bottleneck. But on machines with integrated graphics, there is a fourth bottleneck most people never check: VRAM. And when it runs short, your whole desktop experience suffers.
I ran into this recently on my ThinkPad T14s. After switching from GNOME to XFCE, everything loaded faster, scrolled smoother, and stopped the occasional stutter I had learned to ignore. The reason turned out to be how much of that shared memory pool my lightweight desktop environment and its apps were handing to the integrated graphics.
This is a quick look at why VRAM matters on laptops with integrated graphics (iGPU), how to spot when it is the problem, and why choosing a lighter desktop environment (or a window manager) can make your machine feel like a different computer. At least, in my experience.
Full disclosure: my direct experience is on AMD hardware (ThinkPad T14s with Ryzen iGPU), so if you run Intel graphics and have a cleaner way to spot VRAM pressure, drop it in the comments.
In This Article
What integrated graphics actually use for VRAM

A dedicated GPU has its own VRAM while an integrated GPU (iGPU) does not. Instead, it carves out a slice of your system RAM and treats it as VRAM. On AMD Ryzen laptops this shows up as UMA (Unified Memory Architecture) and is managed by the amdgpu kernel driver.
On Intel it works much the same way. My AMD powered T14s allocates 1 GiB as the UMA frame buffer, with the rest of system RAM available to grow into via Graphics Translation Tables (GTT) when needed.
GTT is a region of regular system RAM that the GPU can address directly. It is still GPU-accessible memory, just living in system RAM instead of the reserved VRAM slice, so reads and writes from the GPU’s side are slower. GTT can grow into system RAM as needed, which is why you never hit a hard wall. The driver handles the overflow silently.
The catch is that the dedicated VRAM slice is small and fixed. On most thin and light laptops it is 512 MiB, 1 GiB, or 2 GiB. When apps and the compositor fill it up, the GPU starts spilling allocations into the rest of the system RAM through GTT.
Even though GTT lives in the same system RAM, GPU access to it is slower because it goes through an address translation layer and shares the memory controller with the CPU, while the reserved VRAM slice is exclusively the GPU’s. That is when you feel it: scrolling hitches, animations drop frames, window resizing stutters, video playback tears.
None of this shows up as high CPU or RAM usage in a typical top or system monitor view. If you are not looking at GPU memory specifically, the machine looks idle but feels slow.
What actually happens when VRAM fills up

VRAM at 78% of 990 MiB with GTT already at 807 MiB. The GPU has well exceeded its dedicated slice and is reaching into system RAM for the rest.
Here is a thing. VRAM never really reaches 100%. On my T14s it floats around 80% under normal load. That is not a bug. The amdgpu driver reserves a small portion of the UMA allocation for itself (display framebuffers, internal driver buffers, kernel bookkeeping) that applications can’t touch.
On a 1 GiB allocation that reserved slice is roughly 80 to 100 MiB. So the real app-allocatable ceiling is closer to 900 MiB, and that is what you see hit as “full” in userspace tools.
When apps actually need more memory than the remaining pool can provide, allocations get placed into GTT (Graphics Translation Table). On an iGPU both VRAM and GTT live in the same physical RAM, so the raw bandwidth gap is small (per AMD’s own ROCm documentation). What you feel instead is the overhead of the driver migrating allocations between regions under pressure, plus memory controller contention when the CPU is also active. What you feel when this happens:
- Scrolling hitches and frame drops, especially in browsers with many tabs or during video playback
- Window switching feels less instant
- Compositor stutter when launching or closing apps
- On heavier loads, brief texture pop-in or black flashes as the driver shuffles allocations between VRAM and GTT
This is why the number to watch is not VRAM sitting at 80% – 90%. That is the normal ceiling. The real pressure signal is GTT climbing while VRAM stays pegged. When you see GTT in the hundreds of megabytes and rising, the driver is churning allocations between regions, and that is when the desktop starts to feel off.
Why your desktop environment eats more VRAM than you think
Every modern desktop environment uses the GPU. The compositor draws windows, blends transparency, animates transitions, and pushes pixels to the display. How aggressively it does this varies a lot between environments.
GNOME‘s Mutter compositor runs everything through OpenGL and keeps the Activities overview, smooth animations, and blur effects GPU-accelerated at all times. KDE Plasma is similar, though recent releases are surprisingly efficient. On the other end, XFCE‘s xfwm4 makes compositing optional, and even with it on there are no animations or effects by default. Window managers like i3, Sway, or Openbox use almost nothing on their own.
A rough ordering from heaviest to lightest on GPU load:
- GNOME ≈ KDE Plasma
- Cinnamon
- MATE
- XFCE
- LXQt
- i3 / Sway / Qtile
Exact usage varies by configuration, theme, and compositor settings, but the general pattern holds.
If you want a full breakdown of how these compare for everyday use (not just VRAM), see my 10 best Linux desktop environments picks for 2026.
The Electron problem
The second half of the VRAM story is your apps. Anything built on Chromium, which today means Chrome and every Electron app, reserves GPU memory for compositing and rendering.
Termius, Discord, Slack, VS Code, Spotify, Postman, 1Password, these are all Electron. Each one spawns its own GPU process and holds onto VRAM while it runs. Firefox also uses GPU acceleration, but its memory behavior is generally less aggressive than Chromium-based apps.
On a desktop with 4 GiB or more of dedicated VRAM, this is background noise. On a laptop with a 1 GiB UMA allocation, running three Electron apps plus a browser plus a GPU-accelerated compositor can genuinely push you into pressure territory.
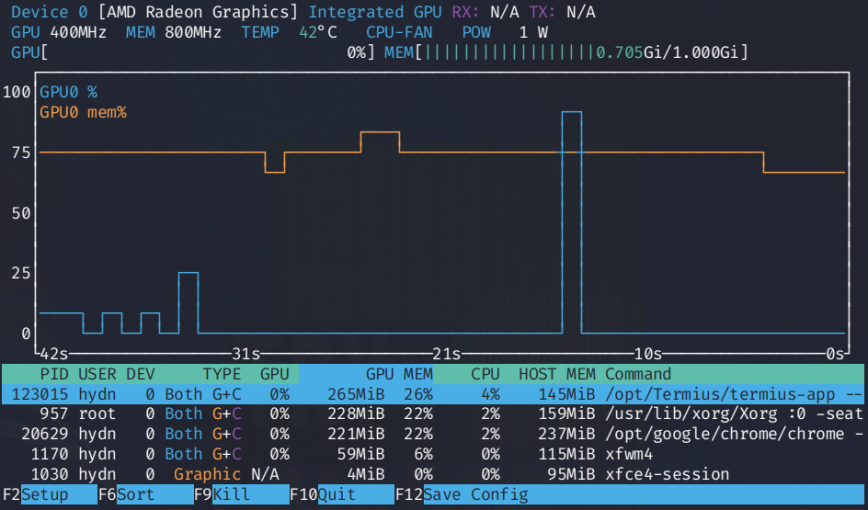
Here is what it looks like on my own machine. The cyan line is GPU VRAM usage, and you can see it drop by roughly a third of a gigabyte the moment I closed a single Electron app:

Screenshot via btm: Closing one Electron app freed about 300 MiB of VRAM on a 1 GiB allocation.
This is why a single app can push an iGPU laptop from smooth to stuttering without any warning from your system monitor.
You can disable hardware acceleration in most Electron apps through their settings, or by launching with --disable-gpu. That shifts the work to the CPU. Scrolling and animations may feel less smooth afterward, so it is a trade-off, not a free win. Worth it only if you are genuinely VRAM-starved.
How to check GPU VRAM usage on Linux
nvtop is useful for GPU monitoring: spotting GPU spikes when you take certain actions in your DE.
You cannot fix what you cannot see. Before the tool list, a quick note on hardware: this diagnostic is really an AMD and Intel iGPU story. If your laptop has an NVIDIA GPU, it is a discrete card with its own dedicated VRAM (usually 4 GiB or more), and you won’t have the shared-pool pressure problem this article describes. Any modern DE will run comfortably.
The rest of this section is for shared-memory iGPU hardware. A few tools, in order of how useful they are for seeing both VRAM and GTT:
- radeontop: AMD only. Shows VRAM and GTT on separate lines, which is exactly what you want for this diagnostic. Best starting point on AMD hardware.
- amdgpu_top: AMD only. Rust-based, more detailed than radeontop, with per-process VRAM and GTT attribution. Toggle VRAM/GTT display with
v. - intel_gpu_top: Intel only. Shows engine utilization, memory bandwidth, and frequency. Less direct about the VRAM/GTT split than the AMD tools, but still useful for spotting pressure.
- nvtop: cross-vendor. Good general GPU monitor with per-process memory, but does not cleanly separate GTT from VRAM on AMD. Fine as a secondary tool.
- btm (bottom): shows RAM, SWAP, and GPU memory in one view. Good for an at-a-glance read, not for the GTT diagnostic specifically. See my full walkthrough: btm: a modern alternative to top and htop.
On Debian or Ubuntu:
sudo apt install radeontop nvtop intel-gpu-tools
amdgpu_top is not always in default repositories. On Debian, grab it from the project releases page.
Then run whichever one matches your hardware:
sudo radeontop       # AMD
sudo intel_gpu_top   # Intel
sudo nvtop           # any vendor
Watch VRAM usage with a browser and a couple of Electron apps open. Close one, watch the number drop. That is a quick way to see how much each app is actually costing you.
Quick self-test

If you want to confirm whether VRAM is actually a bottleneck on your machine, try this (AMD iGPU example, since those are the tools that show GTT directly):
- Install
radeontop(sudo apt install radeontopon Debian or Ubuntu). - Run it and leave it open in a terminal.
- Open your normal working set: browser with a few tabs, plus two or three Electron apps.
- Watch the numbers for a minute of light use (scrolling, switching windows, playing a short video).
Read the result:
- VRAM below ~75%, GTT near zero: you have headroom. VRAM is not your problem.
- VRAM at ~70% to 90%, GTT below 100 MiB: you are at the app-allocatable ceiling but not overflowing. Desktop should still feel smooth.
- VRAM at ~80% to 90%, GTT above 200 MiB: confirmed pressure. A lighter desktop environment, fewer Electron apps, or disabling hardware acceleration in one or two of them will help.
On Intel iGPUs, intel_gpu_top does not expose GTT as a separate number in the same clean way. Watch for sustained memory bandwidth saturation and engine stalls instead, which are the indirect signs of the same underlying pressure.
Why a lighter desktop feels faster on iGPU hardware
This is where it comes together. On a thin and light laptop with integrated graphics, three things are competing for the same pool of VRAM:
- The desktop environment’s compositor
- Every Electron and Chromium-based app you have open
- Hardware video decode, WebGL, and any animations in active tabs
Pick a heavy DE and half your VRAM is gone before you open a single app. Pick a light one and you have room for the apps you actually care about. This is what I felt on my T14s after the GNOME to XFCE switch. Scrolling, window switching, even just opening the applications menu, all of it felt faster. RAM usage was similar. The compositor was just asking less from a shared pool that did not have much to spare.
For the same reason, throwing extra RAM at the problem does not help. If your UMA frame buffer is fixed at 1 GiB in BIOS, adding more system RAM will not expand it.
What you can do on some laptops is raise the UMA allocation in BIOS to 2 GiB, which gives the GPU more dedicated headroom at the cost of a little general-purpose memory. This is the right move if you see VRAM pressure but have RAM to spare. Not all laptops expose this option, so check your BIOS before assuming it’s available.
When a window manager is the right answer
If you want the absolute minimum GPU load, skip the desktop environment entirely and use a window manager. i3, Sway, Qtile, and dwm do almost nothing on their own. Sway is Wayland and still uses the GPU, but minimally. i3 on X11 barely touches it.
The trade-off is customization time. You build your own setup: status bar, launcher, notification daemon, screen locker, wallpaper tool, and clipboard manager. If that sounds like fun, a tiling WM is hard to beat for performance. If it sounds like a weekend you would rather not spend time working on, then XFCE, MATE, or LXQt gives you most of the efficiency with very little time to productivity (TTP).
Practical recommendations
Rough guidance based on your hardware:
- 4 GiB RAM or less, older iGPU: LXQt, XFCE, or a window manager. Skip GNOME and KDE entirely.
- 8 GiB RAM, thin and light with 1 GiB UMA: XFCE or Cinnamon desktop for best balance. KDE Plasma works if you keep an eye on Electron apps.
- 16 GiB RAM, modern iGPU with 2 GiB UMA: Any DE is fine. GNOME and KDE are comfortable.
- Discrete GPU with 4 GiB+ VRAM: Pick whatever you like the look of. VRAM is not your problem.
And regardless of your DE choice, be aware of how many Electron apps you have running. A browser plus three Electron apps is a legitimate VRAM load on any integrated GPU.
Web apps pinned as PWAs share the same browser process and are far lighter than standalone Electron builds. If you care about performance, choose the web version over the desktop app where you can.
Final thoughts
RAM and CPU get all the attention when people talk about lightweight desktop environment integrated graphics choices, but on modern thin and light laptops VRAM is often the silent bottleneck. A heavy compositor plus a handful of Electron apps can fill a 1 GiB UMA allocation faster than most people expect, and the symptoms (stutters, hitches, dropped frames) get blamed on everything except the thing that is actually full.
Before your next distro hop or DE swap, open btm, radeontop, or nvtop and analyse your GPU memory. If it is consistently above 80% during normal use, a lighter desktop environment or a tiling window manager will do more for your experience than any kernel tweak or swap configuration. If you want to keep going on the performance thread, zswap vs zram is the companion article for system memory pressure on the same class of hardware.


