If your Linux server is bogged down by disk I/O, your first step may often be to use the top command in the terminal to check load averages. However, there are times when top shows very high load averages even with low CPU ‘us’ (user) and high CPU ‘id’ (idle) percentages.
This is the case in the video below; load averages are above 30 on a server with 24 cores, but the CPU shows around 70 percent idle. One of the common causes of this condition is disk I/O bottleneck.
In This Article
What is I/O wait bottleneck?
Storage I/O is input/output (or write/read) operations on a storage device, whether that is a spinning disk, an SSD or an NVMe drive. Requests that involve disk I/O can be slowed dramatically if CPUs need to wait on the disk to read or write data. I/O Wait is the percentage of time a CPU sat idle while at least one I/O request was still outstanding. That idle part matters. It is why ‘wa’ falls when the CPU gets busy, even though the storage is just as slow as it was a minute ago.
Let’s look at how we can confirm if disk I/O is slowing down application performance by using a few terminal command-line tools (top, atop and iotop) on a LEMP web server.

Check disk I/O in 2 mins (video).
Using TOP command: load averages and wa (wait time)
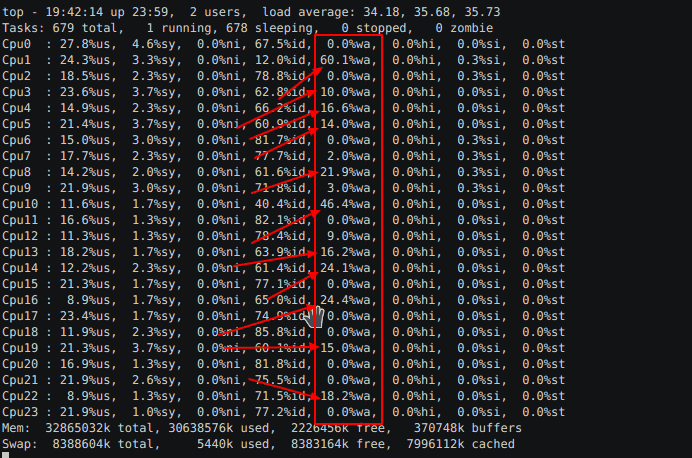
As per the video above, when you enter top, you’ll first glance to the upper-right to check load averages. In this case, it’s very high and thus indicates a pileup of requests. Next, we will most likely glance at the CPU and mem horizontal lines near the top, followed by the %CPU and %MEM columns, to get an idea of which processes use the most resources.
While in top, you will also want to look at ‘wa’ (see video above). On a healthy server it hovers near zero, and brief spikes during a backup or a log rotation are normal. What you are looking for is a value that stays consistently elevated, which suggests your storage device is too slow to keep up with incoming requests. Notice in the video that the initial value averages around 6% wait time.
However, this is averaged across 24 cores, some of which are not activated because the CPU cores are not nearing capacity. So we should expand the view by pressing ‘1’ on your keyboard to view ‘wa’ time for each CPU core when in use. As per the screenshot above, there are 24 cores, from 0 to 23.
Once we’ve done this, we see that ‘% wa’ time is as high as 60% for some CPU cores! So we know there’s a bottleneck, a major one.
One more check while you are here. Load average on Linux counts processes in uninterruptible sleep, not just processes waiting for CPU time. That is how a 24-core box reports a load of 30 while sitting 70 percent idle. List them:
ps -eo state,pid,comm | grep "^D"
One or two is nothing. The same PIDs sitting in D state every time you run it means those processes are parked in the kernel waiting on storage. Next, let’s confirm this disk bottleneck at the device level.
Using iostat to measure disk latency, not just utilization
Load averages and ‘wa’ tell you something is blocking. They do not tell you which device, or whether the disk is genuinely slow or simply busy. iostat answers both. It ships in the sysstat package:
iostat -xz 1
-x gives extended statistics, -z hides idle devices, and the trailing 1 refreshes every second. Ignore the first report. It averages everything since boot and will flatter a disk that only died this morning.
Two columns carry most of the signal. r_await and w_await are the average milliseconds a read or write waited, queue time included. On the server in this article, w_await sat in the hundreds. A healthy SATA SSD answers in single digits.
%util is the column everyone quotes and the one most likely to mislead you. It only means the device had at least one request in flight for that share of the interval. On a spinning disk that maps closely to saturation. On an SSD or NVMe drive, which service many requests in parallel, a device can read 100% util with headroom to spare. Trust await. Treat %util as a hint.
Using ATOP command to monitor DSK (storage) I/O stats
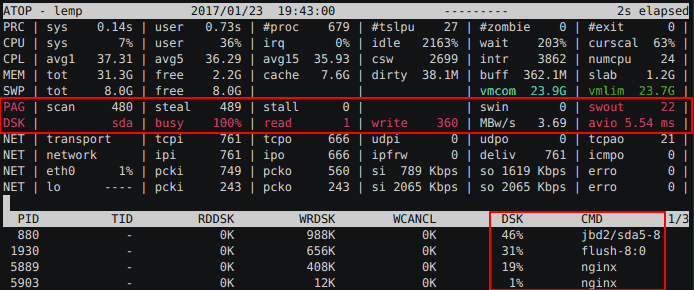
Using atop, next, we see that the storage device is 90 to 100 percent busy. This is a severe bottleneck. The effect is that requests are blocked until disk I/O can catch up. While in atop, press ‘d’ to view the processes and PIDs which are using disk I/O.
Here we see MySQL, Nginx, and PHP-FPM, which are necessary processes, and I would have to write another article about reducing disk I/O on high-traffic L*MP servers. In short, be careful that Nginx (or Apache), MySQL, and PHP-FPM’s access and error logs are not set up to write too frequently to disk and you also want to avoid storing cache (e.g., Nginx cache) to disk in very high concurrent traffic environments.
In addition to LEMP services, also notice ‘flush-8:0’ and ‘jbd2/sda5-8’ along with their PIDs. Neither is an application. ‘flush-8:0’ is the kernel writeback thread pushing dirty page cache out to block device 8:0, which is /dev/sda. On newer kernels you will see it as kworker/u8:2+flush-8:0 instead. ‘jbd2/sda5-8’ is the ext4 journaling thread for /dev/sda5. Both were busy here because of what the applications above were writing, mostly cache files and logs, so treat them as a symptom rather than the culprit.
On this server, I performed a quick SSD benchmark after stopping services and noticed that disk performance was abysmal. The results: 1073741824 bytes (1.1 GB) copied, 46.0156 s, 23.3 MB/s. So although reads/writes could be reduced, the problem here is extremely slow disk I/O.
This client’s web host provider denied this and stated that MySQL was the problem because it often grows in size and suffers OOM kill. On the contrary, MySQL’s growth in memory usage was a symptom of disk I/O blocking the timely return of MySQL queries and with MySQL’s my.cnf max_connections setting on this server being way too high (2000), it also meant that MySQL’s connections and queries would pile up and grow way beyond the available server RAM for all services.
It was growing to the point where the Linux Kernel would OOM kill MySQL. Considering MySQL’s worst-case memory works out to the per-thread buffers multiplied by that ‘max_connections=2000’ setting, on top of the global buffers, this also left PHP-FPM with little free memory as it piled up connections waiting on MySQL < disk. The OOM killer scores processes largely by memory footprint, and MySQL was by far the biggest thing on the box, so MySQL is what it killed.
Using IOTOP command for real-time insight on disk read/writes
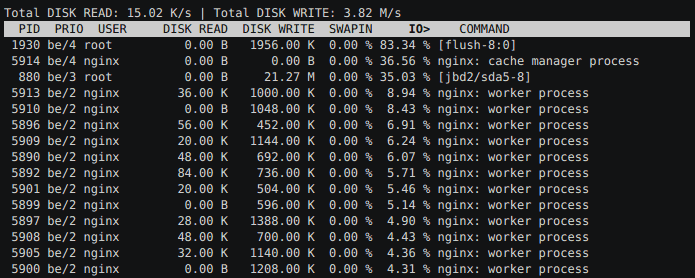
iotop watches I/O usage information output by the Linux kernel. It displays a table of current I/O usage by processes or threads on the system. I used the command: iotop -oPa. Here is what those three options do:
- -o (–only) shows only processes or threads actually doing I/O, instead of every process on the system. You can toggle this while running by pressing o.
- -P (–processes) shows processes only. By default iotop lists every thread, which gets noisy fast on a busy web server.
- -a (–accumulated) shows total I/O since iotop started rather than current bandwidth. This is the one that turns a jumpy live view into a ranked list of offenders.
If iotop starts and every column reads zero, or it warns about delay accounting, the tool is not broken. Delay accounting has been disabled by default since kernel 5.14. Switch it on:
sudo sysctl kernel.task_delayacct=1
That setting is lost at reboot, so add delayacct to your kernel boot options to make it permanent. Also worth knowing: most distributions now ship iotop-c, a C rewrite of the original Python tool, with the same options.
Look at the ‘DISK WRITE’ column; these are not very large figures. At the rate they increment, a reasonably average-speed storage device would not be busy with some kernel logging and disk cache. But at < 25 MB/s write speed (and over-committing memory), disk IO is maxed out by regular disk use from Nginx cache, kernel logs, access logs, etc. The fix was to replace the storage with a better-performing device with faster write speeds than an SD card.
Of course, MySQL should never be allowed to make more connections than the server is capable of serving. Also, the workaround of throttling incoming traffic by lowering PHP-FPM’s pm.max_children should be avoided or only temporary because this means refusing web traffic (basically moving the location of the bottleneck).
Thankfully, the above case of a storage device being this slow is not common with most hosting providers. If you have a disk with average I/O, you could also use Varnish cache or other caching methods, but these will only work as a shield when fully primed. If you have enough server memory, always store everything there first.
The quicker check: /proc/pressure/io
Everything above infers I/O pressure from an idle CPU. Newer kernels will just tell you outright:
cat /proc/pressure/io
On a server in the state described here, that returns something like:
some avg10=44.21 avg60=39.07 avg300=31.88 total=8814592211
full avg10=38.90 avg60=35.62 avg300=29.15 total=7913804412
‘some’ is the share of the last 10, 60 and 300 seconds in which at least one task was stalled waiting on I/O. ‘full’ is the share in which every non-idle task was stalled, and that is the line that tracks a site going unresponsive. Sustained double digits on ‘full’ is the same story the 60% ‘wa’ told us, in one command, with no per-core math.
Pressure Stall Information has been in the kernel since 4.20. Some distributions ship it disabled and need psi=1 on the kernel command line.
Also, look at this list of the top 50 APM tools.
Here are some additional command-line tools used:
iostat, dstat, lsof, vmstat and sar, nmon, iftop, netstat.
Results from a quick dd disk write benchmark on a small StackLinux SSD VPS:
[root@host ~]# dd if=/dev/zero of=diskbench bs=1M count=1024 conv=fdatasync
1024+0 records in
1024+0 records out
1073741824 bytes (1.1 GB) copied, 0.751188 s, 1.4 GB/s
dd answers exactly one question: can this device write a single large sequential stream at a sane speed? That was the question worth asking here, and 23.3 MB/s answered it. It says nothing about IOPS or about latency under concurrency, which is what a busy web server actually produces. When you need those numbers, use fio.
Also, see Your Web Host Doesn’t Want You To Read This: Benchmark Your VPS.
Conclusion
The order matters more than the tools do. Check load averages and ‘wa’ in top, press ‘1’ to expand per core, then confirm at the device level with iostat -xz 1 or /proc/pressure/io. Only then go hunting for the processes responsible using atop and iotop. Skip the device-level step and you end up where that hosting provider ended up, blaming MySQL for a storage problem.
And when the numbers do point at the hardware, benchmark it before you open the ticket. A host will argue with your opinion. It is much harder to argue with 23.3 MB/s.
Published: July 9th, 2017 | Last updated: September 12th, 2026